
Start with the decision
Write the question the team must answer:Which renewals need attention, why, and who owns the next action?This question determines the fields and Dashboard blocks. Do not copy every spreadsheet column into the first model. Use:
- Knowledge for durable policies, definitions, and procedures;
- Data for records that change, such as renewals, tickets, invoices, or assets;
- Dashboards for a repeatable view of that Data.
Create a Data model
Open Data, then select Models in the upper-right navigation. Select New model. Name the model after one business record, such as Customer Renewal. Define fields with stable business meaning: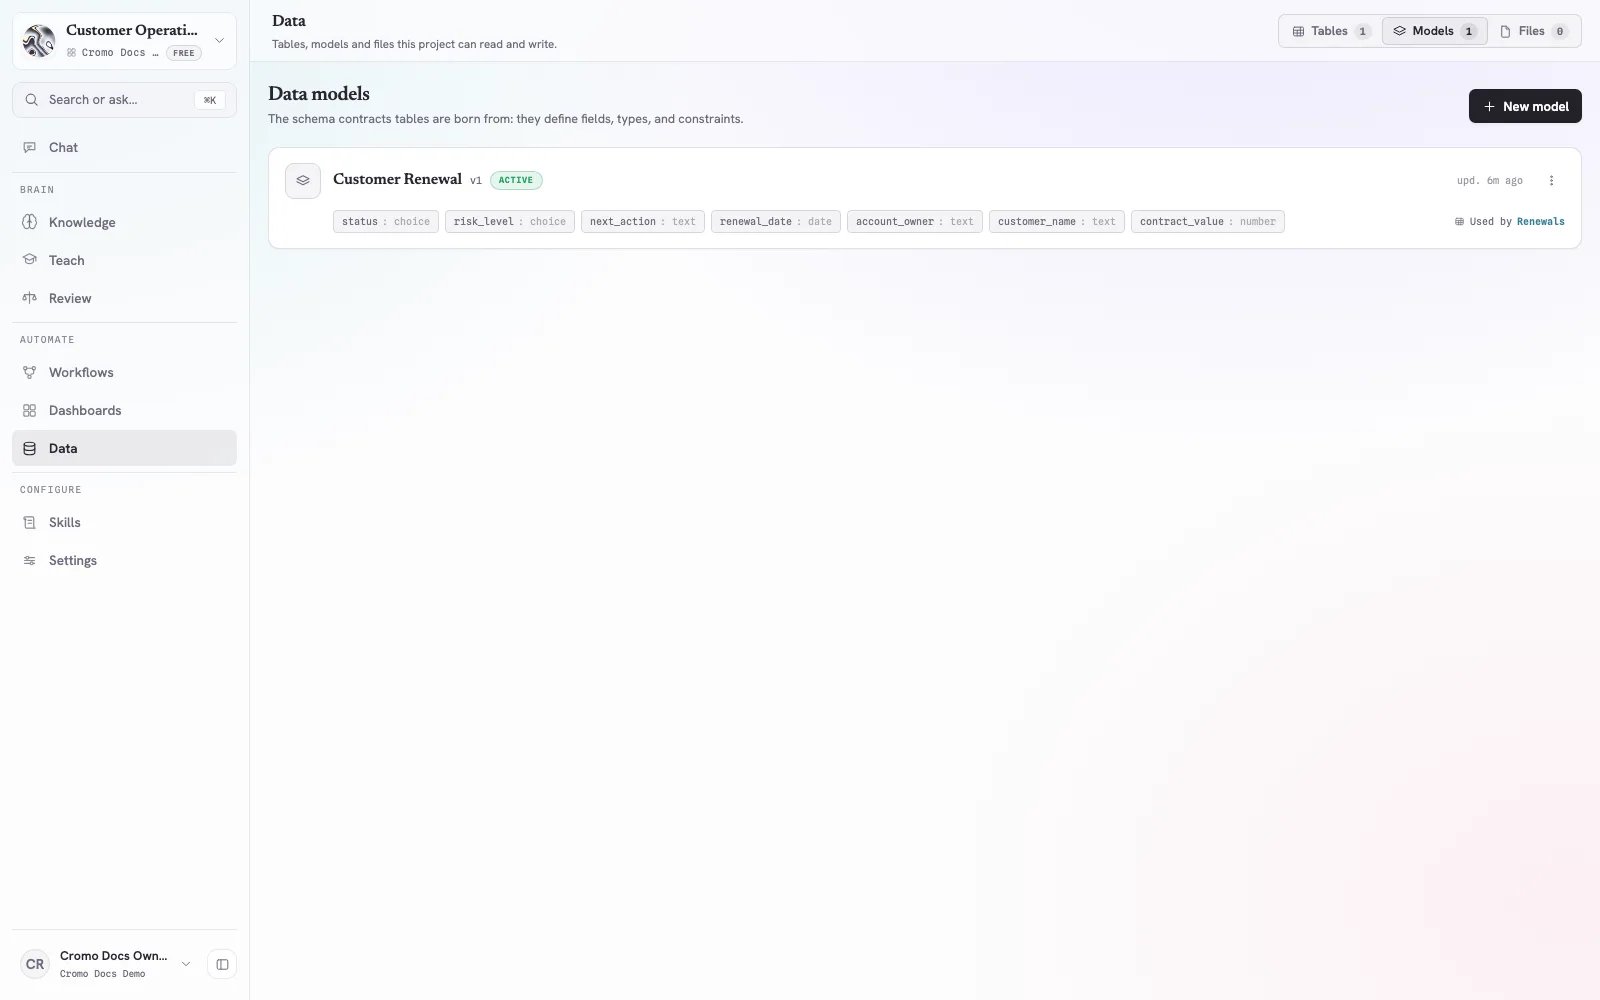
A Data model is the schema contract for every table created from it.
Model rules
- Use
snake_casefield names that remain meaningful outside one report. - Use a choice when the valid values are known.
- Require only fields without which the record is unusable.
- Keep policy prose out of the model; link the relevant Knowledge page from the process instead.
- Create a new model version when the schema meaning changes.
Create the table
Open Data → Tables, select New table, name it Renewals, and choose the Customer Renewal model. Add a small, varied data set before importing or entering a larger list:
Select Add row to enter a record. Correct validation errors before adding more data.
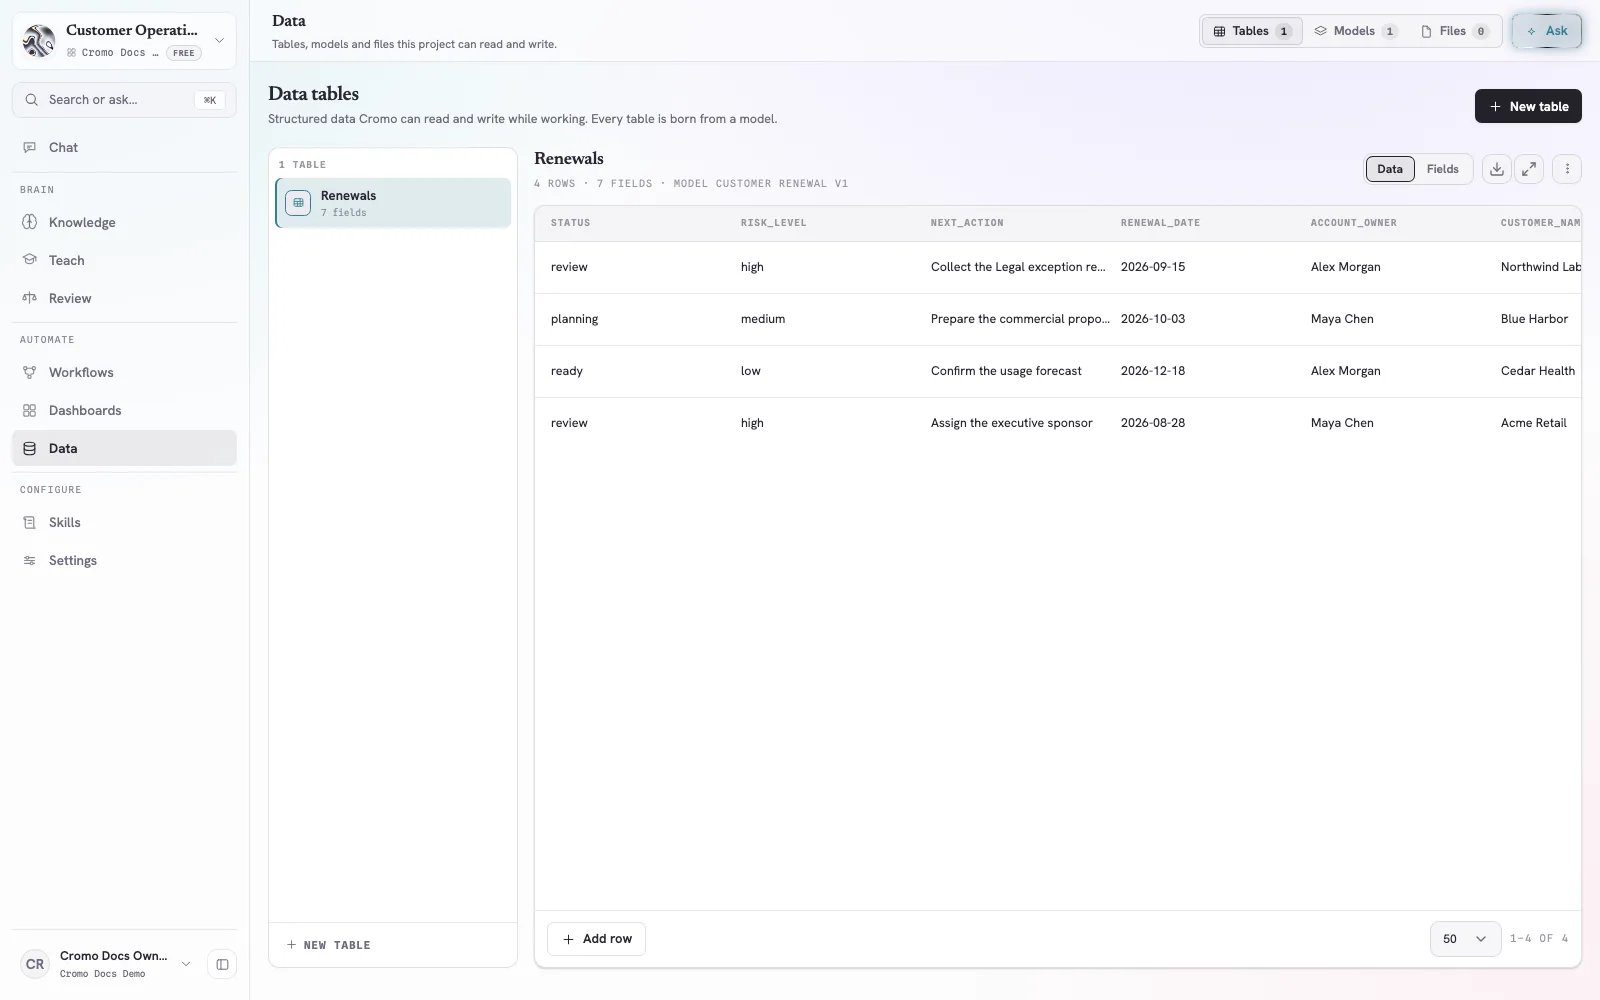
The Renewals table contains four validated records created from the Customer Renewal model.
Verify the table
Check:- dates use the intended calendar day;
- numeric values are numbers rather than formatted text;
- choice values use one consistent spelling;
- each record belongs to this Project;
- missing values are genuinely unknown, not accidentally omitted.
Test the data in Chat
Attach the Renewals table and ask a question with an explicit output contract:Ask Cromo to create the Dashboard
Open Chat or select Ask, then request a view tied to the operational decision:Dashboard creation happens through Chat. The Dashboards page is where you open and manage published views.
Review the published Dashboard
Open Dashboards → Renewal Overview.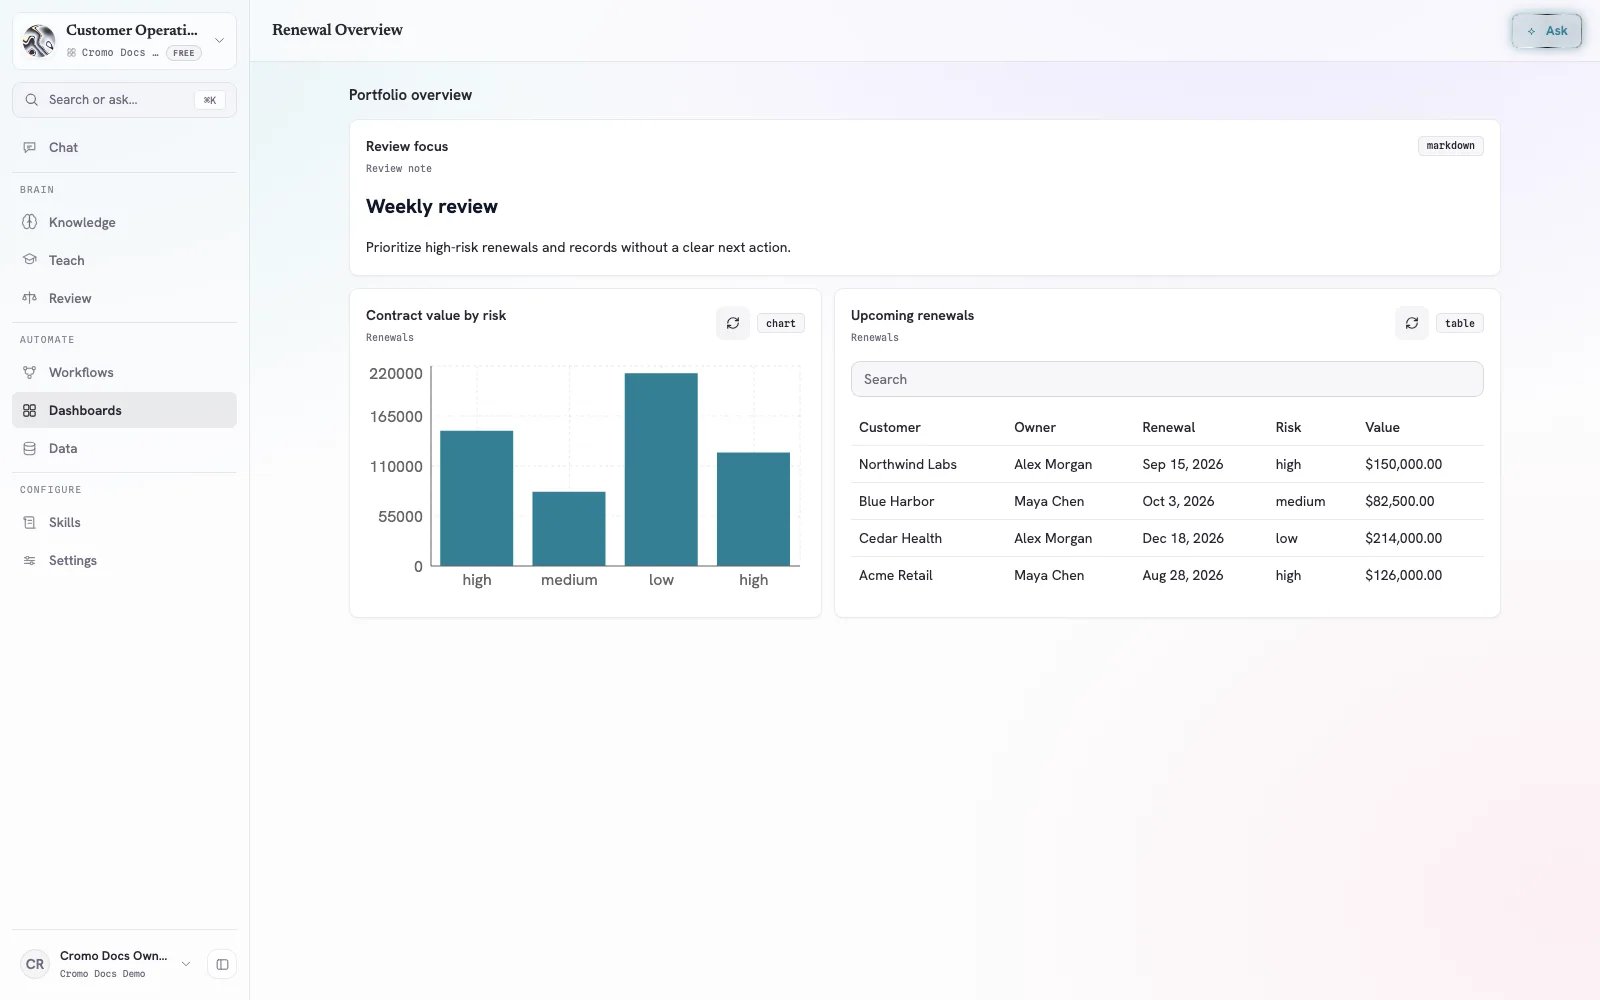
A published Dashboard can combine guidance, charts, and searchable live table rows.
- chart categories correspond to actual
risk_levelvalues; - dates and currency are formatted correctly;
- the table contains the intended fields;
- search finds a known customer or owner;
- empty values remain visibly empty or are explicitly flagged;
- notes describe the review process without inventing policy.
Manage published Dashboards
Return to Dashboards to see the title, publication status, last update, and available actions.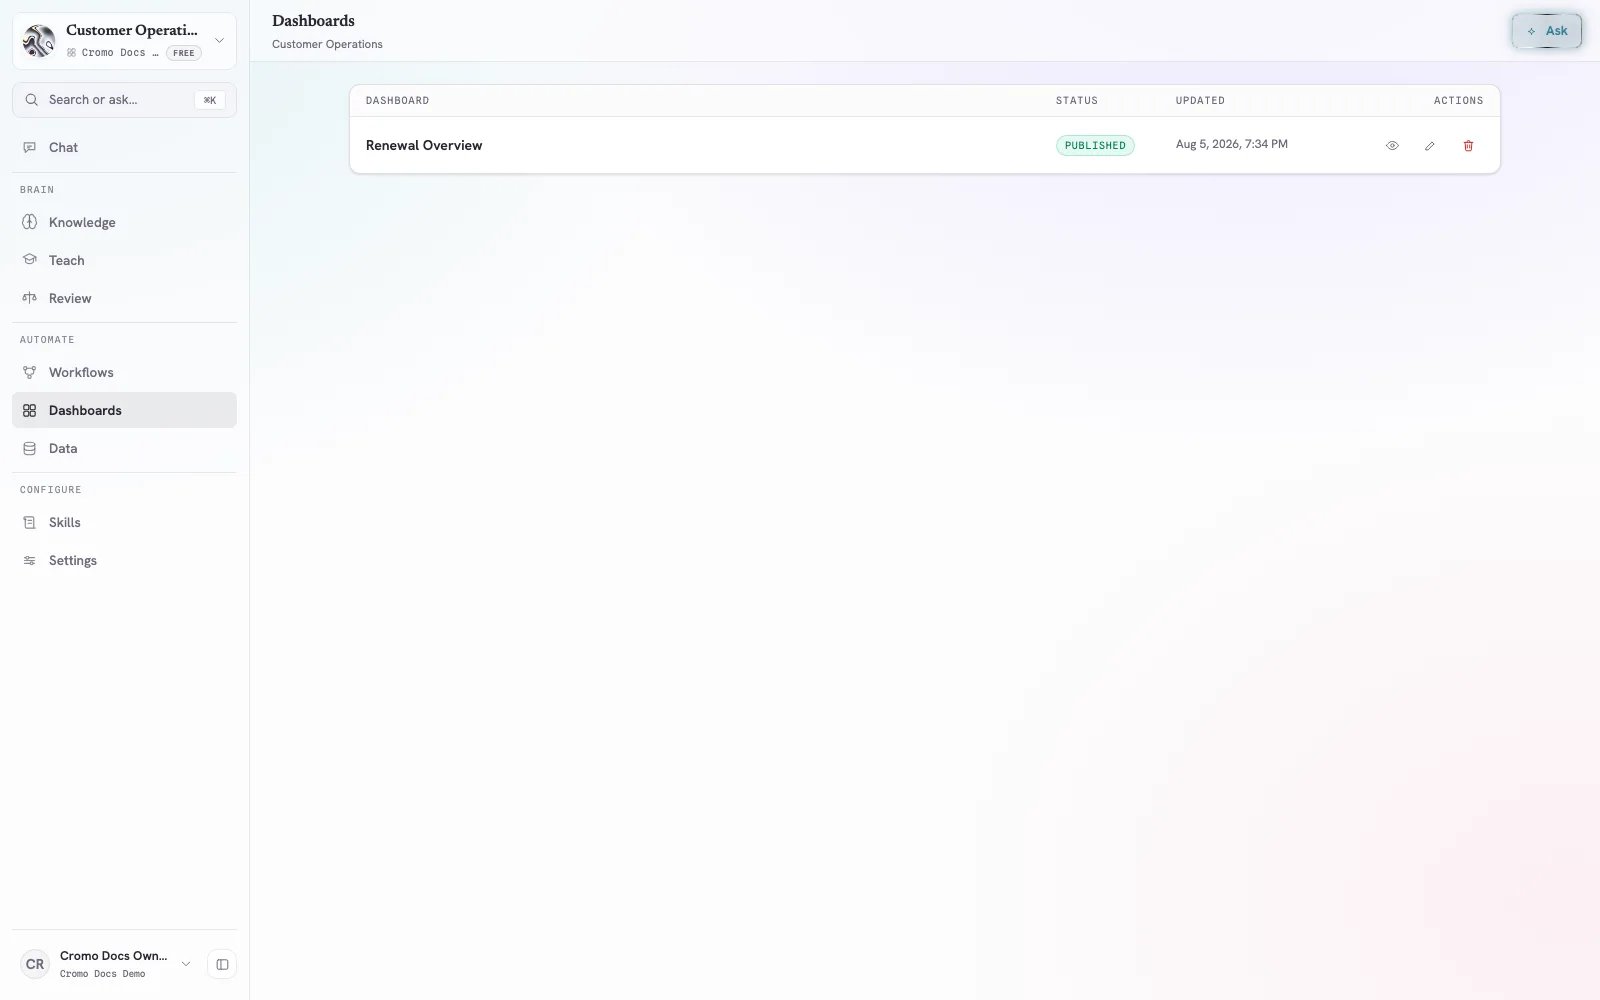
The Dashboards list provides open, rename, and delete actions for each published view.
- open the Dashboard;
- rename its display title;
- delete it after confirming the impact.
Keep the Dashboard trustworthy
Assign separate owners for:
Use a Workflow when updates or review preparation repeat on a schedule. Keep policy definitions in Knowledge rather than embedding changing rules in chart titles.
Recheck the Dashboard after:
- changing the Data model;
- adding, removing, or renaming fields;
- changing choice values;
- replacing a source table;
- changing a Workflow that writes records;
- changing connector access used by the underlying process.
Troubleshooting
New model or New table is unavailable
You need the Member, Admin, or Owner role and membership in the Project. Ask a Workspace Admin or Owner to verify both.A row is rejected
Compare the value with the model: required fields must be present, numbers must be numeric, dates must be valid, and choices must use an allowed value.Chat returns unexpected columns or rows
Attach the intended table explicitly and name the required fields in the prompt. Check that similarly named tables do not represent a different process.The Dashboard cannot load a block
Open the source table and confirm that it still exists and contains the referenced fields. Then ask Cromo to update the Dashboard specification or recreate the affected block.A chart looks numerically wrong
Compare its category and value fields with the underlying rows. A bar per record is different from a grouped total; state the intended grouping and aggregation explicitly when asking for the change.Recent table changes do not appear
Use the block’s refresh action, then reopen the Dashboard. Confirm that the changed records belong to the same table and Project.The Dashboard is correct but not actionable
Add the owner, status, date, risk, and next-action fields needed for a decision. Remove decorative blocks that do not change what the team does next.Completion checklist
- The operational question is explicit.
- The model represents one business record.
- Field names and choice values have stable meaning.
- Representative rows validate correctly.
- Chat returns the expected rows without invented values.
- Dashboard chart and table match a manual data check.
- Empty or missing values remain visible.
- Model, table, Dashboard, and process owners are named.
- Changes to the underlying Data trigger a Dashboard review.